The Ledger / Market data
Johannesburg & Tshwane
Fresh Produce Markets
Real prices. Real markets.
Better agricultural intelligence.
Track fresh-produce prices, volumes and market differences. Built for farmers, buyers, lenders and analysts.
Sample dataset · 16 September 2026Market data Sample
Preview edition All prices, volumes and trends below are illustrative sample data, not live market quotations.
Market data could not load. Please reload the page to try again.
Loading sample prices…
Fresh Produce Prices
Compare average prices across the two markets.
Price Trends
Average market prices (R/kg)
Behind the price
Market Activity
Sample daily trading totals · six tracked commodities only
The price of place
Johannesburg vs Tshwane
Largest absolute price differences first. Prices exclude your transport and handling costs.
| Commodity | Johannesburg | Tshwane | Absolute spread | % spread* | Cheaper market |
|---|
* Signed difference: (Tshwane − Johannesburg) ÷ Johannesburg. A positive spread means Tshwane costs more.
A longer view
Historical Price Explorer
Explore illustrative daily prices. All history is synthetic.
View accessible history table
Market Locations
The municipal wholesale markets covered by this edition.
Market details are loading. Official sources: Joburg Market and City of Tshwane.
Download data
Take the sample dataset into your own analysis.
Downloads include explicit sample-data provenance.
Method & provenance
About the Data
This preview uses a fixed demonstration dataset dated 16 September 2026. It does not contain reported transactions or live quotes from either market.
- Prices
- South African rand per kilogram. All Markets is an equal-weight average of the two market prices, not a volume-weighted national price.
- Movement
- Percentage change against the same commodity and market seven calendar days earlier. Missing comparisons display “Not available”.
- Activity
- Illustrative daily volumes and turnover for the six tracked commodities. Average price is turnover divided by volume.
- History
- Synthetic calendar-day observations for demonstration, including weekends. Price grades, varieties, packaging and fees are not differentiated.
- Market information
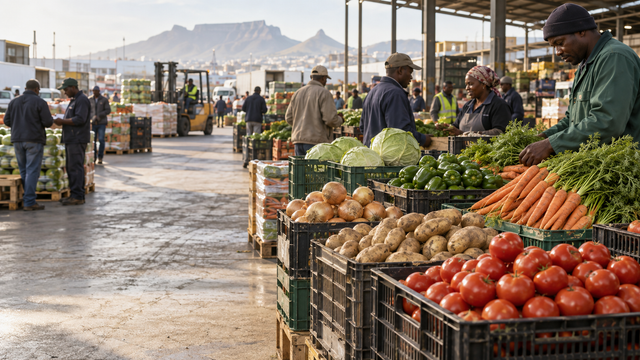
- Names and addresses are linked to official market or municipal sources. The hero is an AI-generated illustration.
Before live publication, the dataset needs authorised source access, grade and unit mapping, validation and clear reporting timestamps.
For models, dashboards & research
Market Data API
Build fresh produce price data into your models, dashboards and research.
Planned · not yet availableGET /api/markets/prices
GET /api/markets
GET /api/commodities
GET /api/markets/{market}/prices
GET /api/commodities/{commodity}/history
GET /api/markets/spreadsThese market endpoints are proposals. The downloads above work locally with sample data.