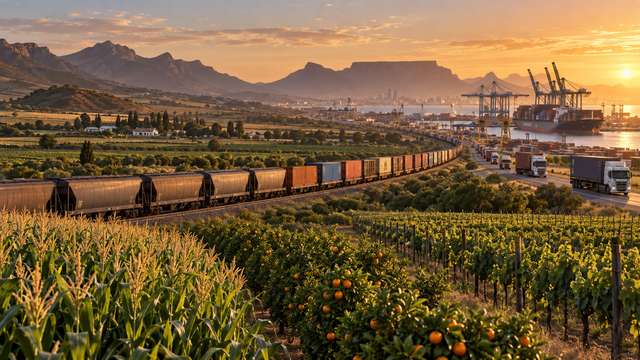
South African agriculture does not compete in global and domestic markets solely on agronomic yield, land quality, labor productivity, or farmgate production costs. A significant share of an agribusiness’s net margin is determined after harvest, along the transport corridors linking inland farms to domestic millers, urban centers, and coastal export terminals. Over the past decade, the operational degradation of state logistics utility Transnet SOC Ltd has effectively imposed an unlegislated, multi-billion-rand logistics tax on the sector. High-value perishable fruits sit in container stacks outside port gates, while bulk grain producers pay premiums to transport heavy commodities by road over decaying municipal road networks.
The structural reform of South Africa’s freight logistics system—marked by the unbundling of Transnet Freight Rail, the publication of a national rail Network Statement, the introduction of third-party private rail operators, and private terminal concessions—is framed as a catalyst for economic recovery. However, evaluating whether these interventions can materially enhance farm profitability, global competitiveness, and agricultural creditworthiness requires examining the mechanics of freight transport. The economic value of a reliable tonne-kilometer extends beyond the simple freight tariff rate; it dictates cash conversion cycles, debt service capabilities, spatial production limits, and national macroeconomic stability.
The R4.6bn profit that isn’t quite a turnaround
A rigorous assessment of South Africa’s freight turnaround requires separating headline accounting adjustments from underlying operational realities. Transnet reported a net profit of R4.6 billion for the financial year ended 31 March 2026, marking a surface-level turnaround from the R1.9 billion net loss recorded in the prior financial period. Total revenue increased by 7.1% to R88.6 billion, supported by tariff increases and marginal freight volume gains.
| Transnet Financial & Operational Metric | FY 2024/25 | FY 2025/26 | Variance / Trajectory |
|---|---|---|---|
| Total Group Revenue | R82.7 billion | R88.6 billion | +7.1% |
| Net Operating Expenses | R52.1 billion | R57.7 billion | +10.8% |
| EBITDA | R30.6 billion | R30.9 billion | +0.7% |
| EBITDA Margin | 37.0% | 34.8% | -2.2 percentage points |
| Headline Net Profit / (Loss) | (R1.9 billion) | R4.6 billion | +R6.5 billion (Accounting turnaround) |
| Durban Gateway Terminal (DGT) Disposal Gain | R0.0 | R12.5 billion | Once-off non-operational accounting gain |
| Underlying Operational Result (Excl. DGT Gain) | ~(R1.9 billion) | ~(R7.9 billion) | Deteriorating core cash burn |
| Total Debt Balance | R144.8 billion | R150.7 billion | +R5.9 billion (+4.1%) |
| Cash Interest Cover Ratio | 1.8x | 1.5x | Covenant breach (Target: 2.0x–2.5x) |
| Freight Rail Volumes | 160.1 Mt | 167.9 Mt | +4.9% (Missed 180 Mt target by 12.1 Mt) |
| Capital Expenditure (CapEx) | R24.0 billion | R23.3 billion | -2.9% (Below R25bn requirement) |
An analysis of Transnet’s financial statements reveals that this reported profitability relies on a single asset transaction. During the period, Transnet executed a key pillar of its Private Sector Participation (PSP) strategy by disposing of a 49.999% equity stake in Durban Gateway Terminal (DGT)—comprising Durban Container Terminal Pier 2—to International Container Terminal Services Inc. (ICTSI) for R10.5 billion. This transaction generated an accounting profit on disposal and related fair value adjustment of R12.5 billion. Excluding this once-off accounting gain, Transnet incurred an underlying operational net loss of approximately R7.9 billion. Net operating expenses expanded by 10.8% to R57.7 billion, driven by personnel, maintenance, and security expenditures, outpacing revenue growth and eroding Transnet's EBITDA margin to 34.8%.
Transnet's balance sheet remains severely constrained. Total debt escalated to R150.7 billion, exceeding annual revenue. Gearing reached 49.4%, while the cash interest cover ratio collapsed to 1.5 times. This places Transnet in breach of financial covenants imposed by commercial lenders, which require a minimum cash interest cover of 2.0x to 2.5x. The entity avoided formal default by obtaining debt waivers from lenders and executing refinancing operations, raising R36.2 billion in new debt market funding—backed by National Treasury guarantees—to satisfy R29.1 billion in maturing debt obligations.
Because interest servicing costs absorb operating cash flows, capital expenditure contracted by 2.9% to R23.3 billion, with over 85% allocated toward urgent maintenance and asset renewal rather than network expansion.
Operationally, rail freight volumes grew 4.9% from 160.1 million tonnes (Mt) to 167.9 Mt. While this reflects recovery from the 2022/23 trough of 149.5 Mt, it missed Transnet’s internal target of 180 Mt by 12.1 Mt. This 12.1 Mt shortfall represents roughly 356,000 heavy truck trips that remained on South Africa's road network. Furthermore, the operational outcome remains far below Transnet’s long-term target of 250 Mt by 2030.
Structural reforms under the National Logistics Crisis Committee (NLCC) and Operation Vulindlela have advanced. Transnet completed the accounting unbundling of Transnet Freight Rail into two separate entities: the Transnet Rail Infrastructure Manager (TRIM) and the TFR Operating Company (TFROC).
In December 2024, the Interim Rail Economic Regulator Capacity (IRERC) gazetted the final Network Statement, defining slot allocation protocols and access tariff methodologies. TRIM subsequently concluded Rail Access Agreements with 11 independent Train Operating Companies (TOCs)—including Grindrod, MSC, MENAR, and Motheo Logistics. While the Department of Transport projects these private operators will add 20 Mt of annual freight capacity, initial operations were delayed into the 2026/27 financial year due to safety permit approvals, rolling stock procurement lead times, and port access integration. The operational foundation of state rail remains fragile, shifting systemic execution risks onto agricultural exporters.
The hidden logistics tax on agriculture
Logistics inefficiencies act as a regressive tax on agricultural income statements. The agricultural value chain follows a linear route: farm gate, primary storage or packhouse, inland rail or road transit, port container terminal or bulk berth, ocean shipping line, and final international destination. At each stage, infrastructure bottlenecks generate direct monetary costs and indirect friction penalties.
Trucking costs form the largest portion of this friction. As Transnet Freight Rail's reliability degraded, bulk and refrigerated cargo transitioned from rail to road. Today, over 70% to 80% of South African grain and fruit moves via heavy road vehicles, compared to the 1980s when rail handled 85% of bulk agricultural cargo. Road transport is roughly 25% to 65% more expensive per tonne-kilometer than efficient long-haul electric rail.
This road dependency exposes agricultural producers directly to liquid fuel market volatility. Following domestic refining closures—most notably the shutdown of the Sapref refinery in 2022—South Africa’s domestic refining capacity dropped from 80% to under 35% of national demand. Consequently, the country imports over 65% of its refined diesel supplies. Geopolitical crude oil disruptions rapidly translate into wholesale diesel spikes, increasing transport expenditure across agricultural supply chains.
At the port interface, structural backlogs generate further costs. In the World Bank’s Container Port Performance Index (CPPI), which measures total vessel stay duration at berth, South African ports consistently rank near the bottom globally.
In the CPPI rankings, the Port of Cape Town ranked 400th out of 400 evaluated global container ports due to severe wind interruptions, aged quay equipment, and low crane handling rates. The Port of Durban ranked 398th, while Ngqura ranked 380th.
Despite operational improvements at Durban—which gained 479 CPPI index points year-on-year following equipment maintenance and ICTSI’s preliminary intervention—South Africa’s principal container terminals continue to underperform regional competitors. Maputo ranked 273rd and Walvis Bay ranked 372nd, processing cargo at higher turnaround speeds.
| Port / Terminal | World Bank CPPI Rank | Operational Efficiency Status | Regional Competitiveness Impact |
|---|---|---|---|
| Cape Town Container Terminal | 400 / 400 | Lowest global rank; severe weather & equipment backlogs | High cold-chain loss risk for deciduous fruit |
| Durban Container Terminal | 398 / 400 | Ranked 398th; significant +479 pt operational recovery | Key citrus/grain gateway; ICTSI concession underway |
| Ngqura Container Terminal | 380 / 400 | Ranked 380th; +165 pt year-on-year gain | Serves Eastern Cape citrus and automotive corridors |
| Port of Gqeberha | 314 / 400 | Highest-ranked SA port; most improved since 2020 | Highest operational reliability among local container ports |
| Port of Maputo (Mozambique) | 273 / 400 | Outperforms all South African container terminals | Diverts regional citrus and bulk grain exports |
| Walvis Bay (Namibia) | 372 / 400 | Superior vessel turnarounds relative to Durban/Cape Town | Key trade corridor for northern production regions |
These port delays generate substantial direct costs across the export supply chain:
Demurrage and Shipping Line Surcharges: Global container lines impose Congestion Surcharges ranging from $150 to $300 per TEU (Twenty-foot Equivalent Unit) to offset extended vessel anchorages outside South African ports.
Cold-Chain Electricity Costs: Perishable exports held in port container stacks require continuous electricity. Extended dwell times increase reefer plug-in charges and diesel generator utilization at packhouses and cold storage facilities.
Quality Claims and Spoilage: Cold-chain disruptions degrade fruit shelf life, leading to price discounting or outright rejections by European and Asian retailers.
Working Capital Extensions: Vessel delays extend the settlement period for foreign exchange transactions, keeping farm working capital tied up in transit for weeks beyond standard operational cycles.
Three crops. Three different logistics problems.
Logistics friction affects agricultural sectors differently based on product bulk, value density, and shelf-life sensitivity.
Maize: the problem is cost
South African maize production centers in the Free State, North West, and Mpumalanga provinces, hundreds of kilometers from coastal ports. As a bulk commodity with low value-to-weight ratios, maize farm profitability is sensitive to land freight tariffs.
Moving maize via Transnet rail wagons from inland silos (such as Reitz or Viljoenskroon) to Durban’s grain terminals historically cost approximately R255 per tonne. Due to rail capacity constraints and cable theft disruptions, over 80% of export grain moved to road haulers, raising transport tariffs to roughly R420 per tonne—representing an immediate transport premium of R165 per tonne (+64.7% cost inflation).
This transport penalty affects domestic grain pricing mechanics. When South Africa produces a surplus above domestic demand, local commodity prices on the JSE/Safex exchange drop toward export parity—the net price realized after deducting all transport, handling, and port loading costs required to deliver grain to international buyers.
When inland transport costs rise by R165 to R200 per tonne, the inland net-realized export parity price falls by an equivalent amount. Current trade estimates show South African maize trading $8 to $16 per tonne above deep-sea export parity due to elevated road transit and port handling expenses.
If private rail participation and TRIM infrastructure repairs lower long-haul grain transport tariffs by R150 per tonne ($8.30/t), inland grain reaches global export parity without requiring a drop in farmgate prices.
For a commercial producer yielding 7 tonnes per hectare across 1,000 hectares (7,000 tonnes total production), a R150 per tonne saving directly restores R1.05 million in net margin. Lower freight tariffs expand the economically viable production radius in western Free State and North West regions, enabling regional grain surpluses to compete globally.
Citrus: the problem is scale and time
The South African citrus industry is a major agricultural export engine. In 2025, the sector packed a record 203.4 million 15kg cartons for export, generating critical foreign currency earnings. Under its Vision 260 strategy, the Citrus Growers' Association (CGA) targets exporting 260 million cartons annually by 2032, a volume growth path expected to support 100,000 additional livelihoods if freight logistics infrastructure can support it.
Citrus logistics are capital-intensive and time-sensitive. Over 95% of citrus exports move in refrigerated containers (reefers) requiring continuous power access. Production is spread across Limpopo, Mpumalanga, the Eastern Cape, and Western Cape, requiring long haulage distances to ports in Durban, Gqeberha, Ngqura, and Cape Town, as well as Maputo.
Port delays create substantial cost burdens for citrus growers. During peak harvest months (July to August), vessel queues at Durban Container Terminal Pier 2 historically extended turnarounds to over 21 days across coastal port rotations. Extended vessel dwell times trigger cold storage re-cooling costs, port plug-in surcharges, and container detention fees, averaging R10 to R18 per carton in direct unexpected logistics costs.
At an industry volume of 200 million cartons, these logistics inefficiencies extract R2.0 billion to R3.6 billion from farmgate margins annually. Operational stabilization at Durban Container Terminal under the ICTSI partnership directly preserves farm realization margins, protecting capital required for on-farm orchard expansion and pest compliance investments.
Table grapes: the problem is timing
Table grape production in the Hex River, Berg River, and Orange River regions represents a high-value, highly perishable agricultural sector. Unlike bulk grain or hardy citrus, table grapes have a narrow post-harvest shelf life. Sector profitability depends on hitting specific marketing windows, particularly the early European winter and pre-Christmas retail demand peaks.
The sector relies primarily on the Port of Cape Town for containerized exports. Equipment failures, combined with summer South-Easterly wind interruptions, have caused severe port congestion, extending vessel turnaround times to 103 hours in 2023/24. These delays accumulated over 3.98 million un-shipped boxes in port stacks during peak harvest periods.
For table grape growers, transport tariff levels are secondary to logistics timing and reliability. Missing a scheduled container vessel departure forces fruit onto subsequent voyages, causing arrivals to coincide with competing Chilean or Peruvian shipments.
Delayed fruit suffers quality degradation, forcing sales into secondary European spot markets at discounts of 30% to 50% off contract prices. Reducing ship turnaround times at Cape Town to 58 hours directly limits price discounting, preserving farm solvency.
| Commodity | Primary Export Corridors | Freight Mode Breakdown | Dominant Logistics Friction Point | Potential Margin Recovery per Tonne / Hectare |
|---|---|---|---|---|
| Maize (Bulk Grain) | Free State / NW to Durban & East London | 80% Road / 20% Rail | Tariff premium of road haulage vs rail; depressed export parity | +R150 to +R200 / tonne (+R1,050 to +R1,400/ha) |
| Citrus (Reefer Cargo) | Limpopo / Mpumalanga to Durban & Maputo | 95% Road / 5% Rail | Port dwell times; reefer plug-in fees; shipping surcharges | +R10 to +R18 / carton (+R25,000 to +R45,000/ha) |
| Table Grapes (High Perishable) | Western Cape / Northern Cape to Cape Town | 98% Road / 2% Rail | Missed shipping windows; cold-chain gaps; spot discounting | +R15 to +R35 / box (+R45,000 to +R105,000/ha) |
When a railway failure becomes credit risk
A key insight for agricultural financiers is that freight infrastructure breakdowns directly impair borrower credit metrics. The transmission mechanism moves systematically through the enterprise balance sheet:
Corridor congestion, port delays, and rail shortages lead directly to operating cost spikes through road haulage premiums, demurrage charges, and extra reefer electricity. This compresses operational EBITDA relative to gross revenue. Simultaneously, extended vessel stays create a cash conversion gap by delaying sales realizations and extending inventory holding periods.
To bridge this liquidity gap, producers experience working capital stress, forcing them to draw down on high-interest seasonal revolving credit facilities. The resulting combination of reduced cash generation and elevated debt servicing obligations contracts the Debt Service Coverage Ratio (DSCR), elevating loan covenant default risks and credit rating downgrades.
When port delays extend shipping schedules by 20 to 30 days, the farmer’s cash conversion cycle expands. Farm operating expenses (fertilizer, diesel, seed, labor) are incurred upfront during the planting and growing season, financed via short-term seasonal credit facilities from commercial banks or agricultural cooperatives.
When export realizations are delayed by port backlogs, farmers cannot settle revolving seasonal facilities before covenant deadlines. Consequently, short-term debt must be rolled over at commercial interest rates, increasing interest expenditure and draining liquidity.
Total South African agricultural debt exceeds R200 billion. Commercial banks (including Absa, Standard Bank, FNB, and Nedbank) hold roughly 61% of this exposure, while the Land and Agricultural Development Bank of South Africa holds R17 billion.
Leveraged agricultural enterprises are vulnerable to interest service shocks. When logistics disruptions compress EBITDA margins while elevating short-term debt burdens, the DSCR—the metric measuring cash flow available to service principal and interest payments—declines toward default thresholds.
A 1,000-hectare farm: when logistics changes bankability
To illustrate this transmission mechanism, consider an empirical financial simulation of a diversified 1,000-hectare farming enterprise producing commercial grain and export citrus under three distinct logistics environments:
Current Logistics Environment (Status Quo): High road dependency (85%), port vessel stays averaging 80+ hours, recurring demurrage and cold-chain surcharges.
Moderate Logistics Improvement: Partial rail migration (30%), reduced port dwell times (STAT 60 hours), stabilized trucking tariffs.
Significant Infrastructure Restoration: Efficient open-access rail network (50% bulk migration), optimized port operations (STAT <45 hours), elimination of port congestion surcharges.
| Financial & Debt Risk Metric | Baseline: Current Environment | Scenario A: Moderate Recovery | Scenario B: Full Restoration |
|---|---|---|---|
| Gross Farm Revenue | R45,000,000 | R45,000,000 | R45,000,000 |
| Direct Production Costs | R26,000,000 | R26,000,000 | R26,000,000 |
| Logistics & Freight Charges | R8,500,000 (18.9% rev) | R6,800,000 (15.1% rev) | R5,100,000 (11.3% rev) |
| EBITDA | R10,500,000 | R12,200,000 | R13,900,000 |
| EBITDA Margin (%) | 23.3% | 27.1% | 30.9% |
| Working Capital Interest Cost | R2,200,000 | R1,600,000 | R1,100,000 |
| Term Debt Principal & Interest | R7,000,000 | R7,000,000 | R7,000,000 |
| Total Debt Service Obligation | R9,200,000 | R8,600,000 | R8,100,000 |
| Net Free Cash Flow | R1,300,000 | R3,600,000 | R5,800,000 |
| Debt Service Coverage Ratio (DSCR) | 1.14x (High Risk) | 1.42x (Acceptable) | 1.72x (Strong Credit) |
| Bankability / Credit Status | Covenant Strain / Watchlist | Fully Serviceable | Expansion Capital Eligible |
Note: Model assumptions based on compiled industry cost structures. Baseline assumes high road haulage rates, extended short-term debt tenure due to port delays, and direct congestion surcharges.
Under the status quo, the enterprise operates with a DSCR of 1.14x, placing it near commercial bank covenant distress thresholds (typically set at 1.20x to 1.25x). A modest climate shock or output price decline under this setup would trigger loan defaults.
When freight network performance recovers to Scenario B, logistics expenditures contract by R3.4 million, while working capital financing costs fall as payment cycles normalize. The resulting DSCR expands to 1.72x, converting a financially vulnerable operation into a bankable business eligible for capital investment loans. Logistics efficiency directly alters agricultural credit risk profiles.
If rail reform is purely commercial, who finances the last kilometre of agricultural rail economics?
Private rail may fix mining before it fixes farming
A prevalent assumption in policy discourse is that introducing private train operating companies (TOCs) will automatically fix freight rail performance. While open-access competition introduces capital and private-sector management, significant operational constraints prevent rapid turnaround.
First, private operators face severely deteriorated track infrastructure. Decades of deferred maintenance by Transnet have left vast sections of the 20,000 km rail network under temporary speed restrictions (slack alleys), limiting train turnaround frequencies.
Second, security risks remain high. Cable theft, signal destruction, and rail line vandalism continue to disrupt primary freight corridors. Although Transnet reported a 7% reduction in security incidents following increased depot monitoring and private security deployments, theft on high-voltage electrified lines remains a persistent operational vulnerability.
Third, access tariff economics under TRIM create commercial friction. In the Network Statement gazetted in late 2024, TRIM moved away from an initial flat rate of 19.7c per gross tonne-kilometer (GTK)—which private industry rejected as unviable—toward a corridor- and commodity-differentiated tariff framework.
This structure uses a floor price (covering variable maintenance) and a ceiling price (reflecting the Regulated Asset Base). However, electricity traction costs are billed separately based on actual consumption, and usage fees are levied on common terminal yards. For low-margin bulk agricultural commodities, access fees can narrow the price gap between private rail tariffs and established road transport rates.
Fourth, rolling stock availability presents an operational bottleneck. Private TOCs face lead times of 18 to 36 months to procure, import, or refurbish heavy-haul locomotives and specialized wagons. The financial feasibility of purchasing capital-intensive rolling stock depends on securing long-term, multi-year freight off-take agreements.
This dynamic creates a market bias toward bulk minerals over agricultural freight. Private TOCs awarded initial slots by TRIM—such as MENAR, Grindrod, and Minrail—naturally prioritize high-volume, predictable bulk commodities like coal, iron ore, manganese, and chrome, or stable container flows. Bulk mining contracts offer consistent year-round rail utilization.
In contrast, agricultural freight is seasonal, subject to harvest volatility, and geographically dispersed across minor rural branch lines. Consequently, private operators are less likely to deploy private capital toward seasonal grain or fruit corridors without revenue guarantees or public underwriting.
South Africa faces a structural risk: freight rail reform could successfully restore core export corridors for mining giants while leaving agricultural producers stranded on expensive road transport. Without targeted policy mandates or dedicated rolling stock leasing pools (ROSCOs) for agricultural cargo, private rail participation will not automatically lower agricultural transport costs.
Freight costs decide where farming is possible
Logistics costs do not merely alter current operational margins; they dictate the spatial limits of commercial agriculture. Transport tariffs define which crops can be grown profitably in specific geographic regions. High freight costs impose an economic barrier around inland rural areas, penalizing production located far from coastal ports or urban centers.
When freight costs drop through reliable electric rail services, this spatial boundary expands outward:
Unlocking Marginal Inland Acreage: Regions in the western Free State, North West, and Eastern Cape hinterlands—currently constrained by high road freight charges to major markets—become economically viable for expanded commercial cropping.
Crop Selection Shifting: High logistics costs force inland farmers to focus primarily on high-value, concentrated crops. Restoring bulk freight rail enables a shift toward volume crops, such as soybeans for oilseed crushing or sorghum, expanding crop rotation systems and improving long-term soil health.
Inland Processing and Storage Investment: Lower freight tariffs encourage investment in primary processing infrastructure near production hubs. Capital flows toward inland grain silos, oilseed crushing plants, fruit cold storage facilities, and agricultural packing houses, shifting value addition closer to rural communities.
Rural Industrialization and Land Valuation: Improved infrastructure reliability increases future farm cash flow expectations, leading to higher agricultural land valuations and expanding the collateral base for rural lending.
Inland transport infrastructure functions as a spatial economic intervention. Fixing freight corridors re-shapes where capital can be deployed profitably across South Africa's rural geography.
From farm margins to the macroeconomy
The microeconomic dynamics of farm gate margins aggregate into broader national macroeconomic outcomes. Agriculture remains a critical contributor to South Africa’s balance of payments, employment, and rural economic stability.
Food Inflation Mitigation: Transport costs represent a major transmission channel for food price inflation. Lowering grain transport costs lowers local mill and feed prices, tempering food inflation for low-income households.
Trade Balance and Foreign Exchange: Unlocking citrus export capacity to reach 260 million cartons by 2032 generates over R10 billion in incremental annual foreign exchange earnings, strengthening the current account.
Road Infrastructure Preservation: Shifting 15 million tonnes of bulk agricultural and mineral freight from road to rail removes over 440,000 heavy truck loads from primary highways annually. This reduces road maintenance budgets for provincial and national road authorities, particularly along heavy transport corridors like the N3.
Fuel Import Reduction: Re-balancing freight transport toward electric rail reduces national diesel consumption, decreasing foreign exchange exposure to imported refined fuels.
GDP Expansion: Modeling by the Bureau for Economic Research (BER) and the National Logistics Crisis Committee indicates that resolving transport and energy bottlenecks could add 2.0 to 3.3 percentage points to national annual GDP growth, supporting broader employment creation.
A railway is not just infrastructure between two places. In agriculture, it is part of the farm’s income statement.
How much improvement reaches the farmer?
Evaluating whether fixing South Africa’s railways will make farming more profitable yields a definitive answer: reforming transport infrastructure directly expands agricultural profitability, but the extent of that gain depends on commodity type and corridor governance.
For high-value export fruit sectors (citrus and table grapes), operational improvements at container ports yield immediate financial benefits. When port stays drop and wind downtime is mitigated through private terminal management, every rand saved on demurrage, reefer plug-in fees, and spot-market price discounting flows back to the exporter. Approximately R60 to R75 of every R100 in port efficiency savings translates directly into farmgate margin preservation.
For inland bulk grains (maize and oilseeds), the transmission mechanism is mediated by global commodity pricing mechanics and grain trading desks. Rail tariff reductions lower inland transport costs to ports, enabling South African grain to hit global export parity without depressing local Safex farmgate prices. In bulk sectors, R40 to R50 of every R100 in rail tariff savings directly increases net farmgate realizations, with the remainder absorbed by grain traders, port handling, and ocean freight differentials.
However, these financial gains will not accrue automatically across all farming regions. Because private train operating companies naturally target dense, profitable mineral corridors, agricultural freight risks remaining dependent on road haulage unless public policy enforces access allocations and rolling stock leasing pools for food supply chains.
If structural rail unbundling successfully mobilizes private investment for agricultural branch lines, freight reform will operate as a systemic productivity intervention—expanding commercial farm margins, improving agricultural creditworthiness, and securing South Africa’s global trade competitiveness.
Sources & research notes
- ratin.net — South Africa's grain economy: Navigating volatility across maize
- engineeringnews.co.za — Opinion: Could South Africa's logistics crisis derail the citrus sector's
- sagrainmag.co.za — Will cable theft and rail inefficiencies derail maize exports? - SA Grain
- citrusresourcewarehouse.org.za — Port inefficiencies must not be allowed to spoil citrus exports
- sanews.gov.za — Transnet records profit | SAnews
- sanews.gov.za — Transnet opens rail network to private train operators | SAnews
- agbizgrain.co.za — Final Network Statement: A step closer to moving grain by rail again
- mdpi.com — Empowering South African Smallholder Farmers: Integrating Climate
- digitfms.co.za — Transnet Annual Results 2026: SA Rail 167.9Mt, R4.6bn Profit
- miningweekly.com — Audited condensed consolidated financial results - Mining Weekly
- transnet.net — www.transnet.net ANNUAL FINANCIAL STATEMENTS 2025
- moneyweb.co.za — As Transnet's rail and port operations stabilise, debt becomes the
- agrisa.org.za — Economics and Trade - AgriSA
- businessforsa.org — Progress reported in government and business partnership, with
- treasury.gov.za — OPERATION VULINDLELA - National Treasury
- sanews.gov.za — Transnet announces 11 Train Operating Companies | SAnews
- journals.co.za — Grain and oilseed industry growth hampered by inefficient transport
- mg.co.za — Maize production blossoms in SA - Mail & Guardian
- coldchainsa.com — A River Full of Crocodiles: South Africa's Converging System Crisis
- businesstech.co.za — South African ports ranked among worst in the world - BusinessTech
- focusontransport.co.za — Ports: SA leads the world in improvement, but trails in performance
- iol.co.za — Cape Town stays bottom of global port rankings despite gains - IOL
- hortgro.co.za — World Bank Port Performance Index Highlights Need for Continued
- sabcnews.com — World Bank ranks Durban as world's least efficient port - SABC News
- sagrainmag.co.za — Record crops and growing carry-over stocks: Why then are SA
- freightnews.co.za — Rail transportation key for citrus industry growth - Freight News
- dailymaverick.co.za — US tariff uncertainty casts shadow over South Africa's citrus lifeline
- africanfarming.com — Vision 260 Strategy: Citrus exports deliver on growth promise
- citrusresourcewarehouse.org.za — South African citrus summit to tackle logistics, market access, and
- fruitnet.com — South Africa pledges logistics overhaul for fruit exports - Fruitnet
- coldchainsa.com — How Broken Links Are Costing South Africa Billions - Cold Chain SA
- freshfruitportal.com — Port chaos stalls South African table grape exports amid aggressive
- farmersweekly.co.za — Managing farm debt: strategies for financial stability - Farmer's Weekly
- cri-world.com — Investment Appraisal of an Animal Feed Plant in South Africa Glenn
- idh-playbook.s3.eu-central-1.amazonaws.com — Inclusive Business Analysis - AWS
- qawebsite.transnet.net — INTERIM INFRASTRUCTURE MANAGER RAIL ACCESS TARIFF
- futures.issafrica.org — South Africa Development Futures
- grainsa.co.za — International export and value adding opportunities for South Africa
- sorghumtrust.co.za — Study to Establish Market Opportunities for Sorghum in South Africa
- saicawebprstorage.blob.core.windows.net — Budget Review
- slideshare.net — NLCC and BUSA Feedback - Mr Ian Bird - 12 February 2025.pdf