Research synthesis: The Ledger
The Brief
- El Niño is firmly established in September 2026. NOAA sees a greater than 90% chance of a very strong event, while WMO sees a near-100% likelihood it persists through February 2027.1–2
- SADC’s August outlook favours below-normal October–December rainfall across most of South Africa — but El Niño intensity does not mechanically determine South African drought severity.3
- South Africa’s farms and food system are much more productive and commercially integrated than in the 1980s. Yet operating leverage means a moderate yield loss can still produce a much larger fall in farm cash flow.
- The climate shock does not stop at the farm. Grain prices can protect surviving producers while simultaneously squeezing feed manufacturers, poultry producers, millers, retailers and households.
- For lenders, the key question is not “Is there an El Niño?” It is “Has climate information become sufficiently borrower-specific and financially material to change expected credit risk?”
Climate resilience is not the absence of loss. It is the ability of a system to decide where that loss lands.
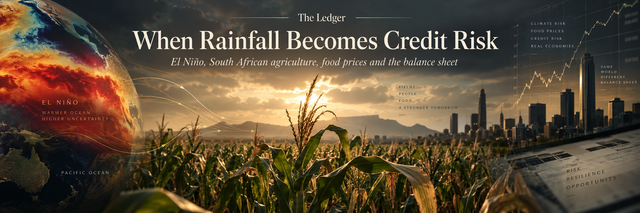
Thousands of kilometres from South Africa’s maize belt, the tropical Pacific is sending a financial signal.
By early September 2026, El Niño was no longer a scenario in a seasonal model. It was established and strengthening. NOAA’s Climate Prediction Center assessed a greater than 90% chance of a very strong event during the Northern Hemisphere autumn and winter of 2026/27, including a 69% probability that the October–December Relative Ocean Niño Index would reach at least +2.5°C. On 3 September, the World Meteorological Organization put the probability that El Niño persists through February 2027 at nearly 100%.1–2
Southern Africa has reason to pay attention. The SADC Climate Services Centre’s August outlook favours below-normal October–December rainfall across most of South Africa, Botswana, Namibia, Zimbabwe and substantial parts of the region. Parts of South Africa remain on the drier side of the probability distribution into January–March 2027.3
But this is where the easy story ends.
A strong El Niño is not a drought invoice with the amount already filled in. The 1997/98 event — one of the strongest on record — caused less damage to South African agriculture than many forecasters feared. Late rain, soil moisture and regional ocean-atmosphere dynamics altered the outcome. FAO’s assessment at the time explicitly noted that the negative impact had been less than earlier anticipated.4
That uncertainty matters because South Africa is not waiting for rain with the same agricultural system it had in 1983. Yields are higher. Seed technology is better. Grain markets are deeper. Farmers can hedge. Retailers source across vast supply networks. Imports can replace some domestic shortages. Satellite data can identify crop stress before a borrower misses a payment.
1. A super El Niño does not guarantee a super drought
ENSO is a naturally occurring coupled ocean-atmosphere cycle. When the central and eastern tropical Pacific becomes unusually warm, atmospheric circulation changes. In Southern Africa, strong El Niño episodes are often associated with hotter and drier summer conditions. “Often” is the important word.
WMO itself stresses that the strength of El Niño does not determine the severity of impacts in any individual country. Indian Ocean conditions, Atlantic conditions, the timing of rainfall and intraseasonal dry spells matter. A season that receives near-normal rainfall in total can still destroy a maize crop if the rain disappears during flowering. Another season can look dry in aggregate but preserve yields if its rainfall arrives at the right moments.2
1997/98 already did.
South Africa entered that season fearing the consequences of a very strong El Niño. The final maize crop was lower, but favourable late weather made the outcome far less severe than anticipated. ENSO strength is therefore a risk signal, not a South African loss function.
This is the first link between climate science and credit risk. Both disciplines deal in distributions, not certainties. A seasonal forecast changes the probability of a bad outcome. It does not tell a lender which borrower will default.
2. Four decades of stress tests
The most useful way to understand the modern risk is not to ask whether El Niño causes drought. It is to compare what happened when major climate shocks hit very different versions of the South African agricultural economy.
Selected El Niño-era maize outcomes
Historical chart data
| Episode | Million tonnes |
|---|---|
| 1991/92 | 2.956 |
| 1997/98 | 7.693 |
| 2015/16 | 7.779 |
| 2023/24 | 12.85 |
1982/83 belongs to an era of much lower national maize productivity and a more interventionist agricultural finance architecture. Drought losses helped entrench government-supported carry-over debt schemes that would later become a large fiscal and financial problem.
1991/92 is arguably the most important historical case for this article even though it was not the strongest El Niño analogue. It shows the transmission from crop failure into the credit system with unusual clarity. A World Bank review records that carry-over debt at 33 cooperatives responsible for 90% of grain production rose from R1.4 billion before the drought to R2.4 billion afterwards, while total member debt increased from R3.6 billion to R4.9 billion. The share of members above the 50% debt-burden threshold at which cooperatives would not extend production credit rose from 28% to 45%.5
The drought had become more than an agricultural event. It was now a financing event. Farmers who had lost one crop were at risk of losing access to the credit required to plant the next one.
1997/98 is the falsification case. A huge Pacific anomaly did not produce the predicted South African catastrophe. Maize production came in around 7.7 million tonnes, down but not disastrous relative to the warnings circulating earlier in the season.4
2015/16 was the modern drought stress test. Government reported a roughly 30% decline in national maize planting, including 32% in Free State and 43% in North West. Grain prices reached record levels. Feed-intensive livestock sectors were squeezed. A survey cited by the government found roughly 370 large commercial-bank farming clients at risk of failure because drought had impaired their ability to service debt.6
2023/24 gives us a different lesson. South Africa’s final 2024 commercial maize crop was 12.85 million tonnes from 2.636 million hectares, with soybeans at 1.848 million tonnes after severe heat and mid-summer dryness damaged summer crops.7 Yet the consumer price outcome was dramatically calmer than in 2016: food and non-alcoholic beverage inflation was 2.5% in December 2024, compared with food inflation peaking at 12% in December 2016.8–9
The climate shock had not disappeared. Its economic transmission had changed.
3. South African farming really has become stronger
There is a temptation, especially in finance, to interpret every drought through losses. That misses one of the most important structural changes in South African agriculture: the productive frontier has moved substantially.
Modern maize genetics, conservation agriculture, better planting decisions, irrigation, precision application, weather information, futures markets and more efficient logistics all provide buffers that did not exist in the same form or scale forty years ago. The correct conclusion is not that technology has made drought irrelevant. It is that a moderate physical shock now lands on a much more productive agricultural system.
The national numbers make this visible. In 1997/98, the Department of Agriculture recorded 7.693 million tonnes of maize from 3.56 million hectares — about 2.16 tonnes per hectare. In 2024, 12.85 million tonnes came from 2.636 million hectares — roughly 4.87 tonnes per hectare.7,10
Higher average yield is not the same thing as lower financial sensitivity.
A farm can produce far more maize per hectare than its predecessor and still be financially fragile if the modern production system carries higher input commitments, expensive machinery, seasonal credit and large debt-service obligations.
4. The farm can survive the drought. Can the cash flow?
A crop does not need to fail completely for the farm’s finances to fail.
The reason is operating leverage. Seed is paid for before harvest. Fertiliser has already been applied. Diesel has already been burned. Machinery finance does not fall because rainfall does. Labour, insurance and administrative costs remain. Interest keeps accruing.
Revenue, by contrast, is exposed to the crop.
The arithmetic is easiest to see on an illustrative 1,000-hectare Free State grain farm. Assume a normal maize yield of 6 tonnes per hectare, a realised price of R4,000 per tonne, R14 million in variable production costs, R3.5 million in fixed overhead and R3.5 million in annual debt service. These figures are deliberately illustrative rather than presented as a representative national budget.
Interactive · When yield becomes DSCR
The simulator reveals the core problem. A 20% reduction in physical output does not automatically mean a 20% reduction in revenue because local prices may rise. But it can still remove a much larger share of the farm’s free cash flow because costs do not fall proportionately.
That distinction is critical for lenders. Agricultural credit is not ultimately repaid with tonnes. It is repaid with cash.
5. Drought has a natural hedge — but only for farmers with grain
There is an important counterargument to the idea that drought automatically weakens farm creditworthiness: lower supply can raise the price of the crop that survives.
The South African government made this point explicitly after the 2015/16 drought. Producers who were able to plant maize and achieve a yield could benefit sufficiently from higher prices to increase gross revenue year on year. The severe financial pain was concentrated among producers who could not plant their intended area or achieve adequate yield.6
This creates a natural hedge: farm revenue = tonnes harvested × realised price.
A 15% price increase can offset part of a 20% yield decline. But the mechanism is brutally uneven. A farmer with no crop has no natural hedge. Zero tonnes multiplied by a record price is still zero revenue.
6. The drought leaves the farm
Interactive · Who absorbs the drought?
Revenue uncertain
Working capital ↑
SAFEX / basis ↑
Substitution ↑
ECL / restructuring
For South Africa’s animal-protein chain, yellow maize and soybeans matter because they are key feed inputs. Poultry in particular is deeply embedded in the feed system: South African Poultry Association statistics show broiler feed accounted for 43.9% of AFMA animal-feed sales in 2023/24, with layer feed another 11.5%.11
The drought can therefore create opposite outcomes inside the same agricultural economy. Grain scarcity can improve the economics of a farmer with a harvest while weakening the margin of the business that buys that grain.
7. Retailers are shock absorbers — until they are not
The retail shelf is where climate risk becomes politically visible, but it is not where the shock necessarily starts — or where all of it ends.
A naïve model of food inflation assumes a commodity price rises by 20%, therefore the grocery item eventually rises by roughly 20%. South African evidence shows that this can be badly wrong.
BFAP-linked research examining vertical price transmission in the wheat-to-bread and maize-to-maize-meal chains found an estimated long-run price-transmission elasticity of 0.63 for maize meal. In other words, the historical relationship implied incomplete pass-through from changes in the underlying maize price to retail maize-meal prices. The authors suggested one possible reason: maize meal can operate as a “key value item” for retailers, creating an incentive to absorb some cost increases — although they were careful to say that particular explanation required further empirical proof.12
Interactive · Commodity shock is not shelf-price shock
This is why “farm-gate inflation” and “food inflation” are not interchangeable. Retailers can delay price transmission through inventory. They can negotiate with suppliers. They can change the mix of brands and pack sizes. They can push private label. They can absorb some increases in gross margin. Or, when cost pressure becomes too large or too persistent, they can pass it to consumers.
And because major retailers possess more procurement scale and financial flexibility than many smaller suppliers, the decision about where to absorb the shock is partly a question of bargaining power.
That does not imply abusive behaviour. It means that resilience is shaped by who has the strongest balance sheet and the greatest ability to change terms.
The shelf price is the outcome of a negotiation across the chain.
When retailers suppress pass-through, someone else may absorb the cost: the processor, supplier or retailer margin. When they cannot, the consumer receives it. Climate risk therefore becomes a question of value-chain bargaining power.
8. The consumer may experience a different drought from the farmer
The contrast between 2016 and 2024 is instructive.
After the 2015/16 drought, food inflation reached 12% in December 2016. Stats SA linked the surge partly to the drought-driven fall in agricultural production.9
In 2024, South Africa endured another serious summer-crop shock. Yet food and non-alcoholic beverage inflation was just 2.5% in December.8
That is not evidence that climate risk no longer matters for consumers. It shows that the consumer experiences the combination of domestic harvests, global commodity markets, exchange rates, imports, inventory, value-chain costs and retailer behaviour.
A drought can therefore hurt a farmer while leaving the consumer relatively insulated. The opposite is also possible: a modest domestic crop problem can become a large consumer-price problem if the rand is weak, global prices are high and import parity is expensive.
For lower-income households, the distributional effect is sharper because staple foods take a larger share of available income. When the grocery basket rises, households do not merely “pay more for food.” They reduce spending elsewhere, switch proteins, change pack sizes, downgrade brands or cut discretionary consumption. The agricultural shock becomes a demand shock for the rest of the economy.
9. South Africa can protect itself by exporting the shock
There is also a regional dimension.
South Africa is not an isolated food economy. In surplus seasons, maize moves into neighbouring SADC markets. In tighter seasons, domestic availability and price incentives can reduce the volume available for regional buyers. That forces importing countries to find alternative sources — sometimes including deep-sea white maize that is less liquid globally than yellow maize.
National resilience can therefore create regional fragility.
If South African storage, imports and supply-chain depth keep domestic shelves supplied, that is a success. But if the mechanism involves reducing regional exports, some of the drought cost moves across the border instead of disappearing.
This is why the 2026/27 SADC outlook matters beyond South African crop estimates. SADC’s August forecast favours below-normal rainfall not just across most of South Africa but across Botswana, Namibia, Zimbabwe and much of the region during October–December.3 A simultaneous regional shortfall reduces the ability of neighbouring markets to offset one another.
10. When does a weather forecast become a credit signal?
This is the point at which climate analysis stops being an ESG discussion and becomes a credit-risk problem.
The wrong model is: El Niño → Stage 2.
The better model is a sequence of evidence.
| Signal | What it tells the lender | Possible action |
|---|---|---|
| ENSO / seasonal forecast | Raises portfolio-level probability of adverse weather | Scenario refresh; concentration review |
| Rainfall, heat, soil moisture | Confirms local physical stress | Increase monitoring frequency |
| NDVI / crop condition / CEC revisions | Translates weather into probable production impact | Borrower outreach; updated yield assumptions |
| SAFEX / input costs / hedging | Determines whether price offsets volume loss | Reforecast borrower margins |
| DSCR / limit utilisation / liquidity | Shows financial transmission | Watchlist / re-underwriting / SICR assessment |
| Arrears / concessions / restructuring | Lagging but strong evidence of credit deterioration | Stage 2 / Stage 3 assessment under policy and IFRS 9 |
IFRS 9 is more forward-looking than many shorthand descriptions imply. It requires an entity assessing significant increases in credit risk to consider reasonable and supportable information that is available without undue cost or effort. The standard explicitly says that when forward-looking information is available, an entity cannot rely solely on past-due information. It also notes that lifetime expected credit losses are generally expected to be recognised before an instrument becomes past due.13
That does not mean a bank should automatically migrate every dryland maize borrower to Stage 2 because NOAA changes its ENSO forecast. It means the lender needs a defensible bridge from climate information to expected credit deterioration.
Climate information becomes credit information when it changes expected repayment risk.
A seasonal El Niño probability is weak borrower evidence. A local rainfall deficit combined with NDVI deterioration, a lower verified yield forecast, high facility utilisation and a projected DSCR below policy tolerance is much closer to the economics IFRS 9 is trying to capture.
This matters for portfolio monitoring because climate risk is spatial. A dryland grain book concentrated in North West does not have the same risk profile as irrigated horticulture elsewhere. Two farms in the same district may also have radically different outcomes depending on irrigation, equity, hedging, crop rotation, insurance and working-capital headroom.
The Prudential Authority has pushed South African banks in the same general direction. Guidance Note G2/2024 calls on banks to integrate climate-related risk into governance and risk-management frameworks, including ICAAP. G3/2025 updates climate-disclosure guidance with reference to Basel and IFRS climate-related disclosure frameworks.14–15
The crucial point is not that the PA has created a special “El Niño capital charge.” It has not. The direction is that material physical climate risks should enter conventional risk management rather than live in a separate sustainability silo.
11. Same weather. Different balance sheets.
Climate hazards are geographically correlated. Financial resilience is not.
Imagine two neighbouring farms receiving exactly the same rainfall. The first has freehold collateral, a diversified crop mix, unused overdraft capacity, forward contracts, modern equipment and several seasons of retained earnings. The second farms under weaker tenure, has little collateral headroom, relies on expensive seasonal finance and has no meaningful insurance or hedge.
They receive the same weather. They do not have the same probability of default.
This is why the resilience gap facing emerging farmers is not reducible to agronomy. Access to capital determines whether a temporary production shock becomes a permanent exit from farming. The historical 1991/92 experience is particularly revealing: once farmers cross the point at which lenders or cooperatives will not finance the next crop, climate risk starts to reproduce itself financially into the following season.5
12. Who finances the bad year?
Every agricultural system has to decide where catastrophic volatility ultimately sits.
It can remain with farmer equity. It can be transferred to an insurer or reinsurer. A commercial bank can refinance it. A DFI can provide patient capital. Government can guarantee or subsidise part of the risk. Consumers can pay higher prices. Or taxpayers can fund relief after the damage has occurred.
The interesting policy question is therefore not simply whether South Africa spends enough on drought relief. It is whether some of that expected future loss could be reduced more cheaply before the drought.
South Africa already has relevant infrastructure. Land Bank’s Agro Energy Fund is a R1.2 billion blended-finance facility established with the Department of Agriculture to finance alternative-energy assets for energy-intensive agriculture, including irrigation and cold chain.16 The broader Blended Finance Scheme combines grant and debt funding to support black producers and agricultural value-chain participation.17
These are not drought-insurance programmes. But they show the architecture through which resilience capital can be delivered.
The answer will not always be yes. Irrigation can fail when catchments are depleted. Capital-intensive technology can increase fixed costs. Poorly designed subsidies can finance assets that do not materially reduce risk.
But a financial system that only restructures after drought is effectively choosing ex-post loss absorption over ex-ante risk reduction without demonstrating which is cheaper.
13. The next agricultural breakthrough may be financial
South Africa has spent decades improving the productivity of the farm. The next stage of resilience may require improving the financial architecture around it.
That means agricultural credit designed around seasonal volatility rather than generic monthly cash flow. It means better use of geospatial data before distress appears. It means insurance products that can survive correlated weather losses. It means finance for water efficiency and soil resilience that is evaluated against avoided cash-flow volatility. It means distinguishing a viable farmer suffering a one-season liquidity shock from an insolvent business being repeatedly rolled forward.
And it means recognising that the food system contains multiple balance sheets capable of absorbing the same shock.
The farmer can absorb it through lower margin. The processor can absorb it through lower margin. The retailer can absorb it through procurement and pricing decisions. The consumer can absorb it through a more expensive basket. The bank can absorb it through restructuring and ECL. The state can absorb it through guarantees, disaster relief or DFI capital.
But the loss does not vanish simply because South Africa still has food on the shelf.
The Pacific is now raising the probability of another serious test. If the 2026/27 season becomes dry, it will tell us something important about South African agriculture. Not simply whether the maize crop survives, but whether the institutions around it — markets, processors, retailers, households, insurers, banks and the state — have become as sophisticated at absorbing climate volatility as farmers have become at producing through it.
That is the moment rainfall becomes credit risk.
The Ledger View
- Do not confuse El Niño intensity with South African loss severity. 1997/98 remains the essential warning against deterministic climate narratives.
- Agronomic resilience and financial resilience are different. Higher yields do not eliminate operating leverage, liquidity pressure or debt-service risk.
- Retailers and processors are part of the shock-absorption architecture. Commodity inflation does not pass one-for-one to shelves; margins, inventory, contracts and sourcing determine who carries the wedge.
- For agricultural lenders, climate data should become progressively more borrower-specific. ENSO starts the monitoring conversation; crop condition, cash flow and expected default risk determine the credit conclusion.
- The policy frontier is ex-ante finance. South Africa should be able to compare the cost of financing resilience before drought with the expected cost of relief, restructuring and credit losses afterwards.
Sources & further reading
- NOAA Climate Prediction Center — ENSO Diagnostic Discussion, 13 August 2026.
- World Meteorological Organization — El Niño set to become very strong, 3 September 2026.
- SADC Climate Services Centre — SARCOF-33 2026/27 outlook.
- FAO/GIEWS — South Africa, August 1998.
- World Bank — South African Agriculture: Structure, Performance & Options for the Future.
- GCIS — Inter-Ministerial Task Team on Drought, September 2016.
- Department of Agriculture / Crop Estimates Committee — final 2024 summer crop figures.
- Stats SA — December 2024 CPI.
- Stats SA — drought and food inflation analysis.
- Department of Agriculture — Abstract of Agricultural Statistics 2017.
- South African Poultry Association — Poultry Industry Statistics 2024.
- BFAP / Agrekon — Vertical price transmission in South African food chains.
- IFRS Foundation — IFRS 9 Financial Instruments.
- Prudential Authority — Guidance Note G2/2024.
- Prudential Authority — Guidance Note G3/2025.
- Land Bank — Agro Energy Fund.
- Land Bank — Blended Finance Scheme.
- Department of Agriculture — Economic Review of South African Agriculture 2024/25.
Editorial note: Forecasts are probabilistic. The article does not treat the 2026/27 climate outlook as an established agricultural outcome. The farm cash-flow and retail pass-through interactives are illustrative analytical tools, not forecasts or representative financial advice.